
Read your week
A picture guide to reviewing a week of time with the Dashboard and Reports, and exporting it.
This guide uses the Dashboard (Pro plan, or the 14-day Pro trial) and Reports (Plus plan and above).
1. Open the Dashboard on this week
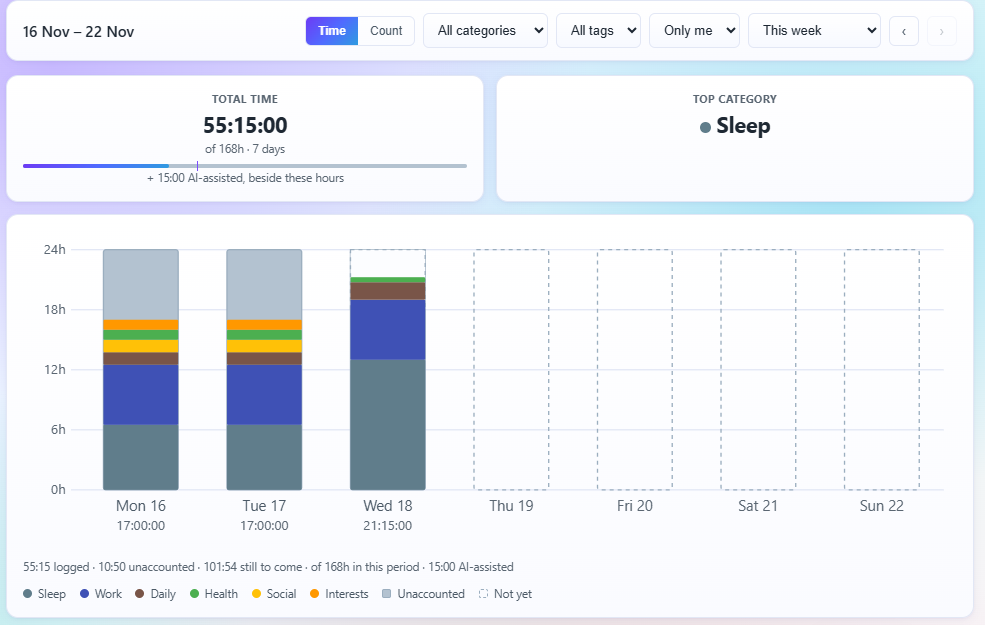
Open Dashboard. The period starts on This week. Use ‹ to look at last week instead.

2. Read the totals and the chart
Total time shows how much you logged, and Top category where most of it went. The chart shows each day against the 24 hours it had.
3. See the split by category
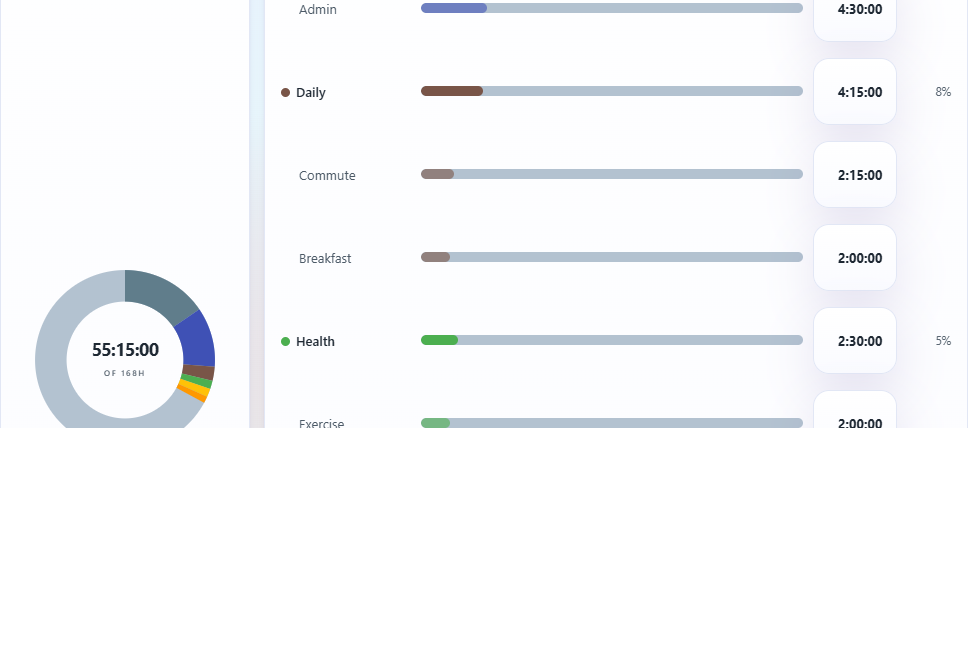
The donut and the breakdown beside it show how the week divided between categories. Pick one category from All categories to look at it alone.
4. Check your habits
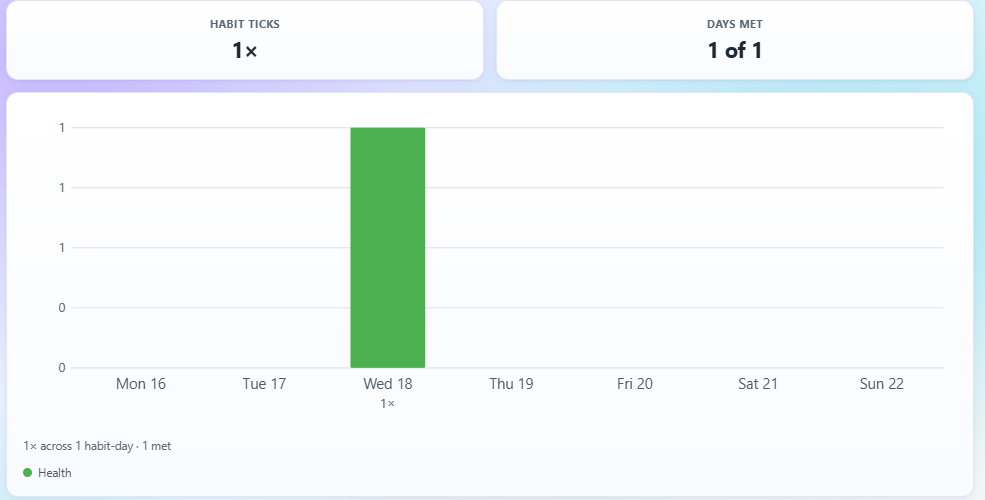
Scroll down to Habits for the week's habit ticks and the days you met your targets.
5. List and export the week
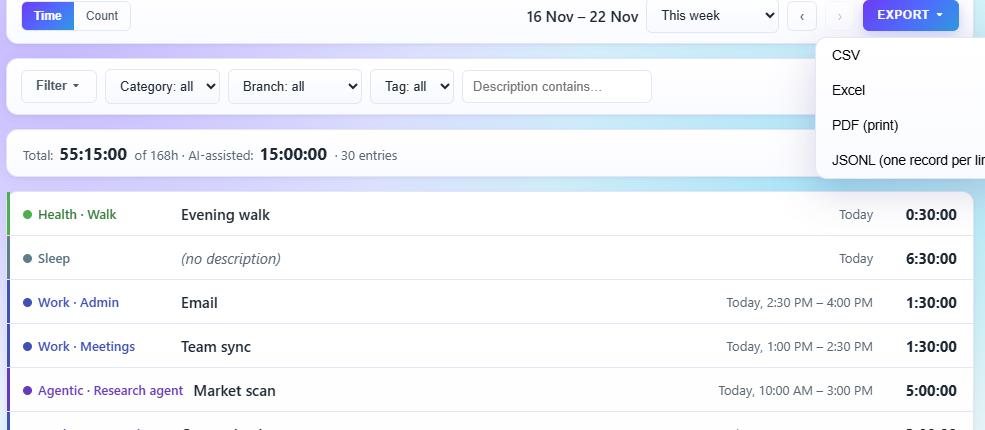
Open Reports with the same period. Every entry is listed with the total at the top. Press Export and choose CSV or PDF (print) to keep or share it.
Want to change what you track next week? See Categories and tags.